India's Covid Story : A Brief Analysis
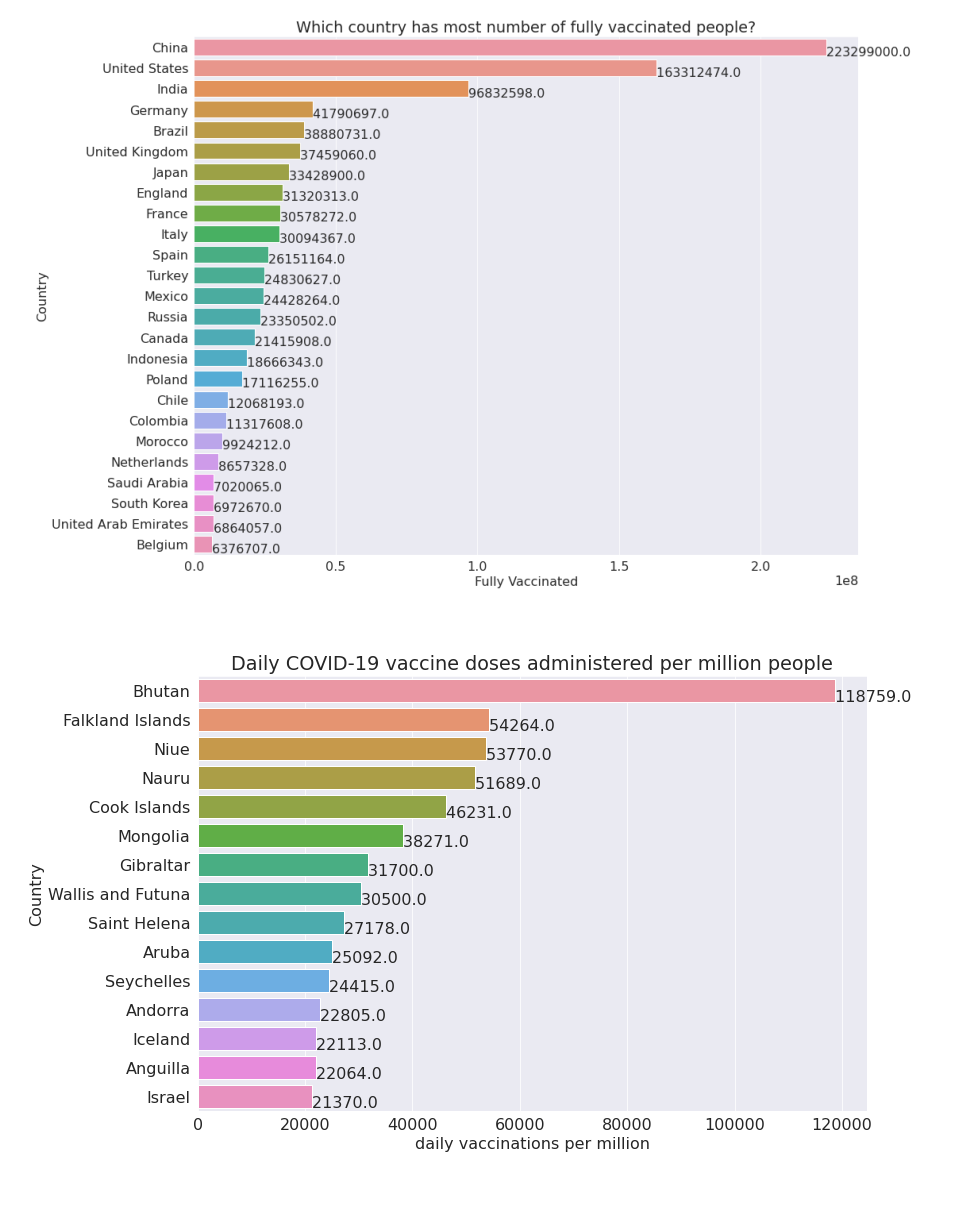
Number of fully vaccinated individuals across countries
The highest populated country China tops the list, whereas other nations severely affected by COVID-19 such as USA and India take the next two places.
Vaccine doses administered per million people
The smaller nations and islands such as Bhutan and Falkland Islands make their way to the top. India is not among the top 14 countries in this regard.
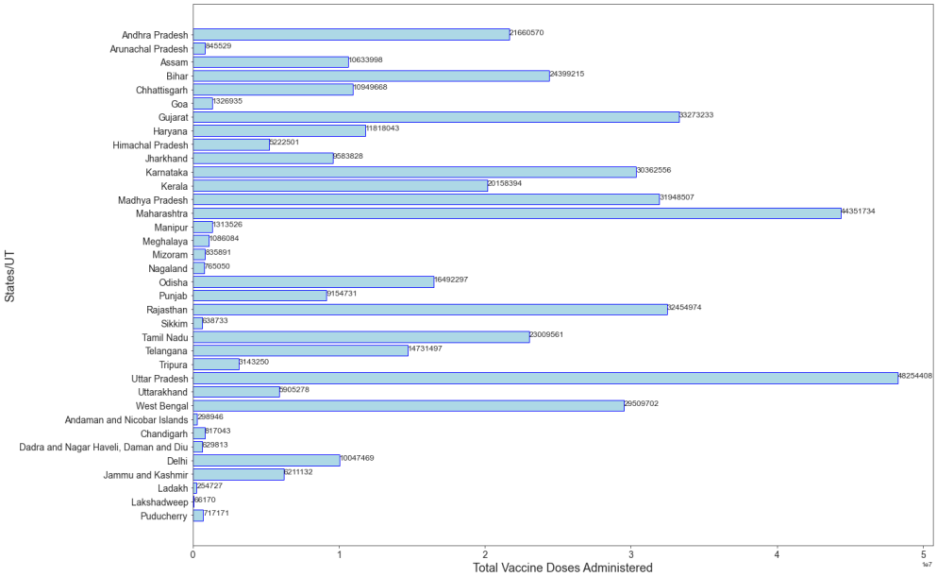
Number of vaccine doses administered by Indian states
Uttar Pradesh and Maharashtra are the leading states for doses administered in the country.
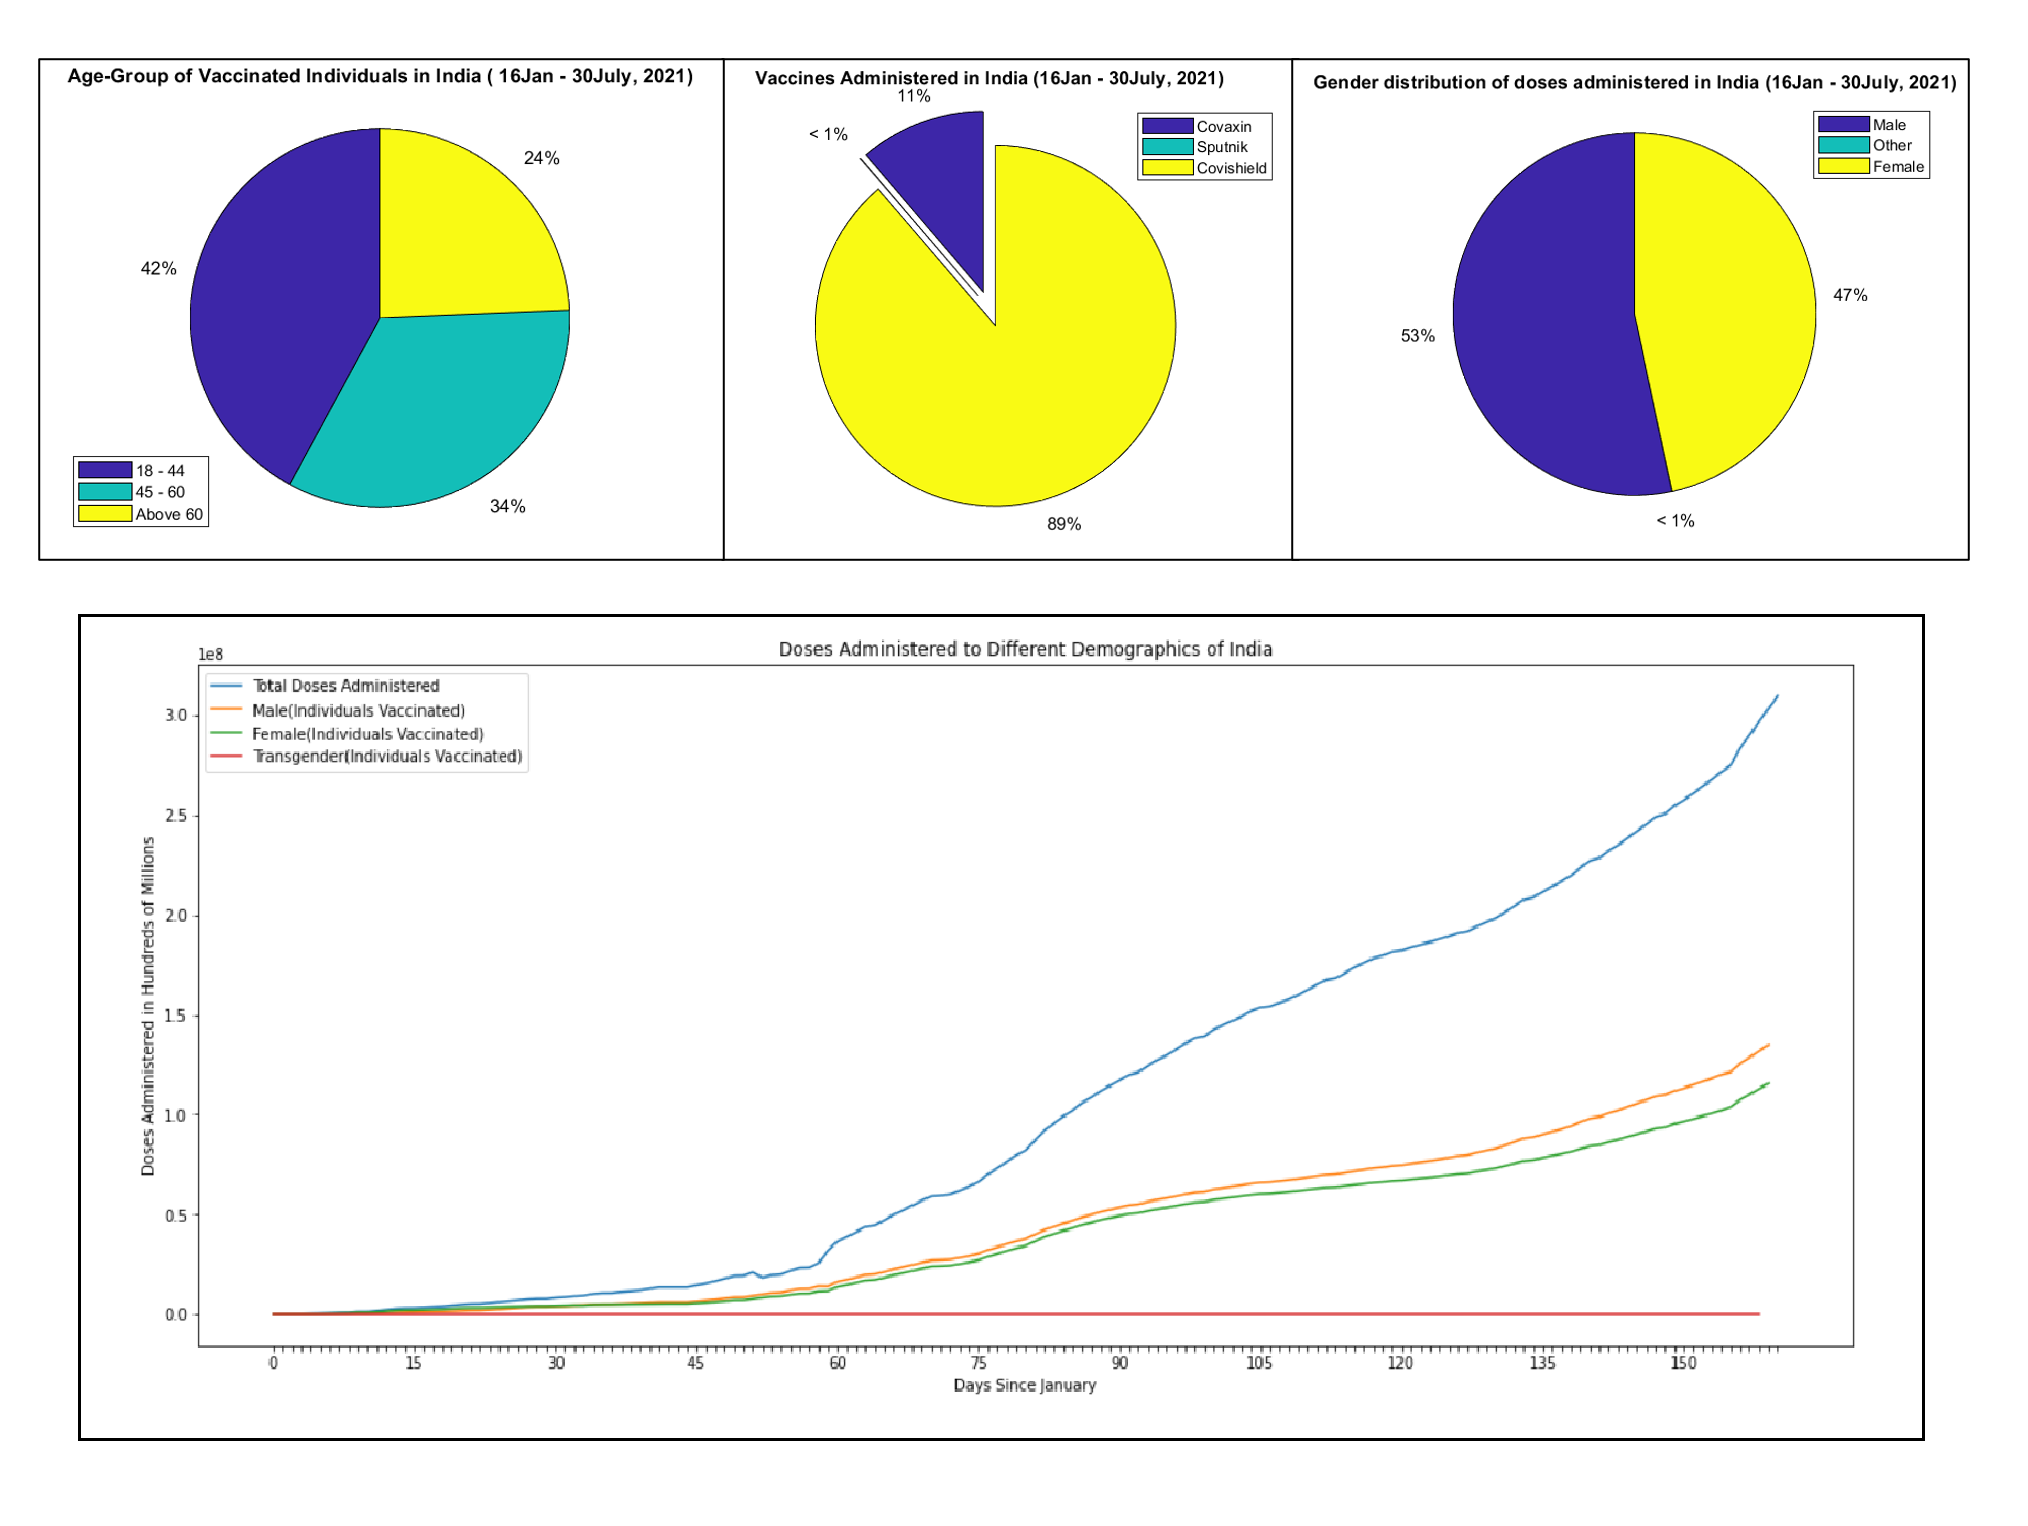
Vaccine doses administered on the basis of age-group, vaccine brand and gender.
There are no clear preferences according to age group and gender. Individuals aged 18- 44 years got the most doses, this group also represents majority of the country's population.
Covishield is the most preferred company for vaccines.
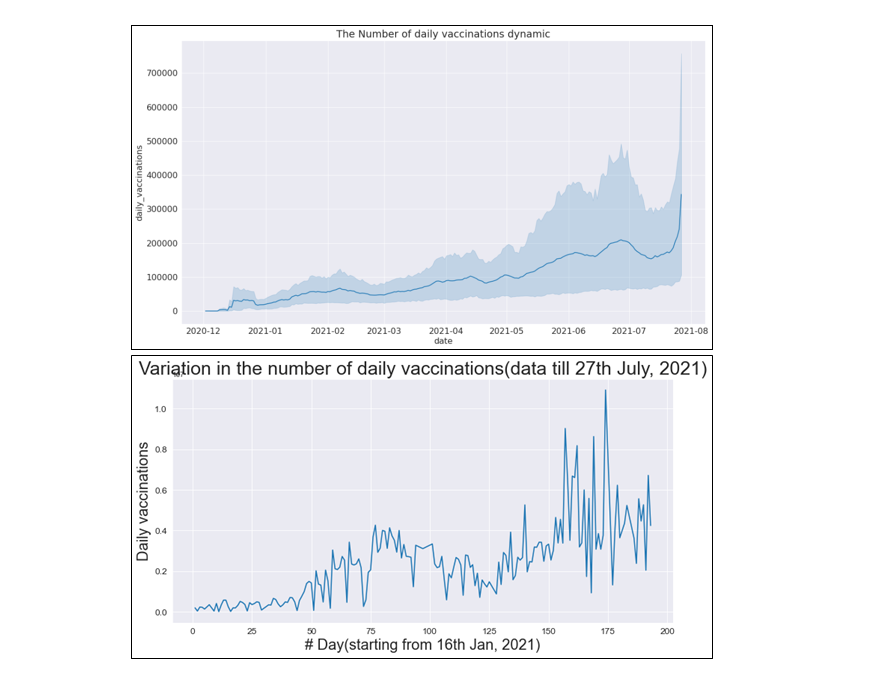
Variation of daily vaccinations in India.
Day-to-day vaccine dosage shot up after the 2nd wave hit India (March-June, 2021).
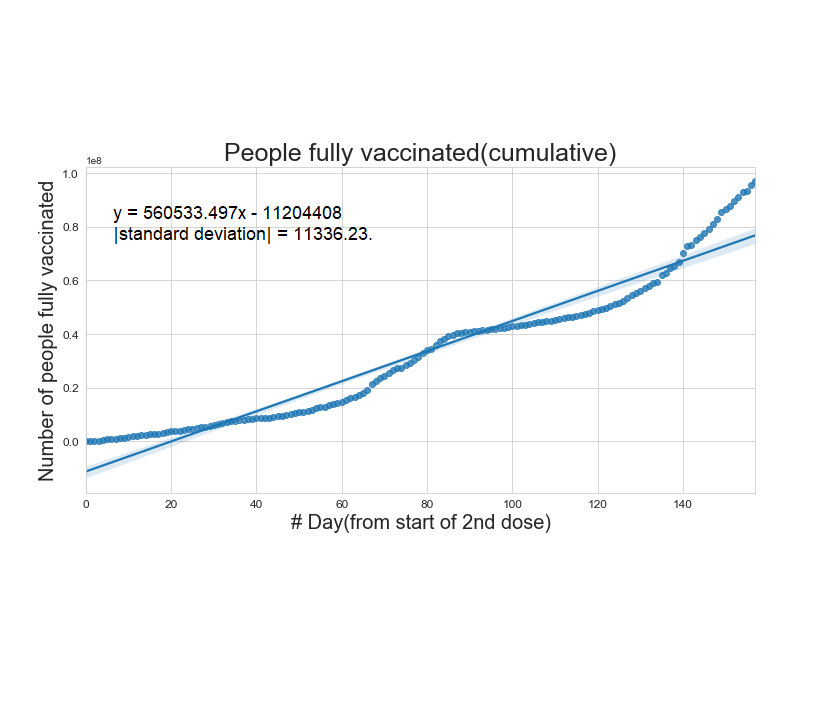
Cumulative number of fully vaccinated people as a function of time
The straight line is a linear fit to the data.
"The vaccine delivery dropped from 3.5 million per day (March) to an average of 1.6 million per day
this week. Assuming vaccine supplies at the same rate, it will take until February 2022 for the
country to vaccinate 300 million people, which represents only 20% of the population."
Reference Link
Using this linear fit, India will be fully vaccinated by 10-10-2027. (Considering India's population as 136.64 crore)
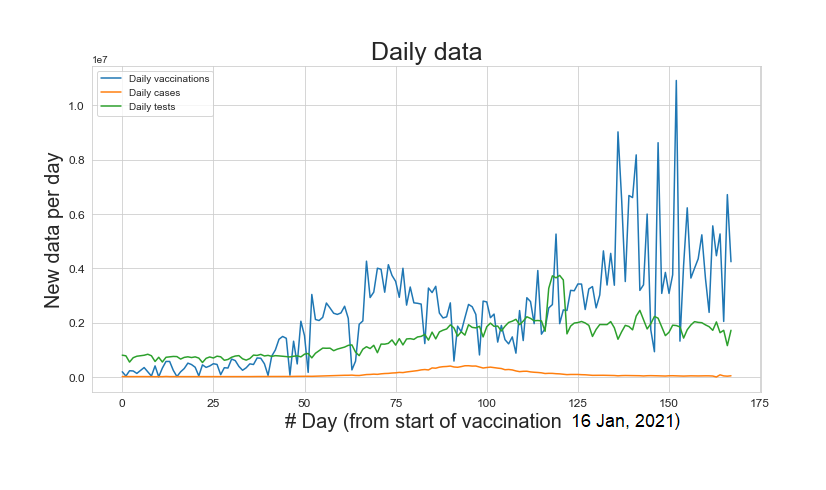
Joint distribution of daily cases, vaccinations and tests
After the daily cases increased during March-June, 2021, the preventive and diagnostic measures escalated.
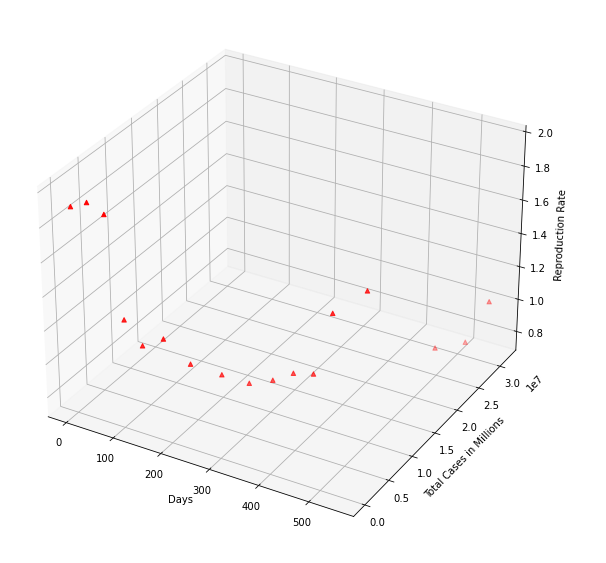
Reproduction rate of the virus and the total COVID-19 cases
Virus mutations and new strains emerging with enhanced infectivity and virulence rate, could be the reason for the rise in cases.
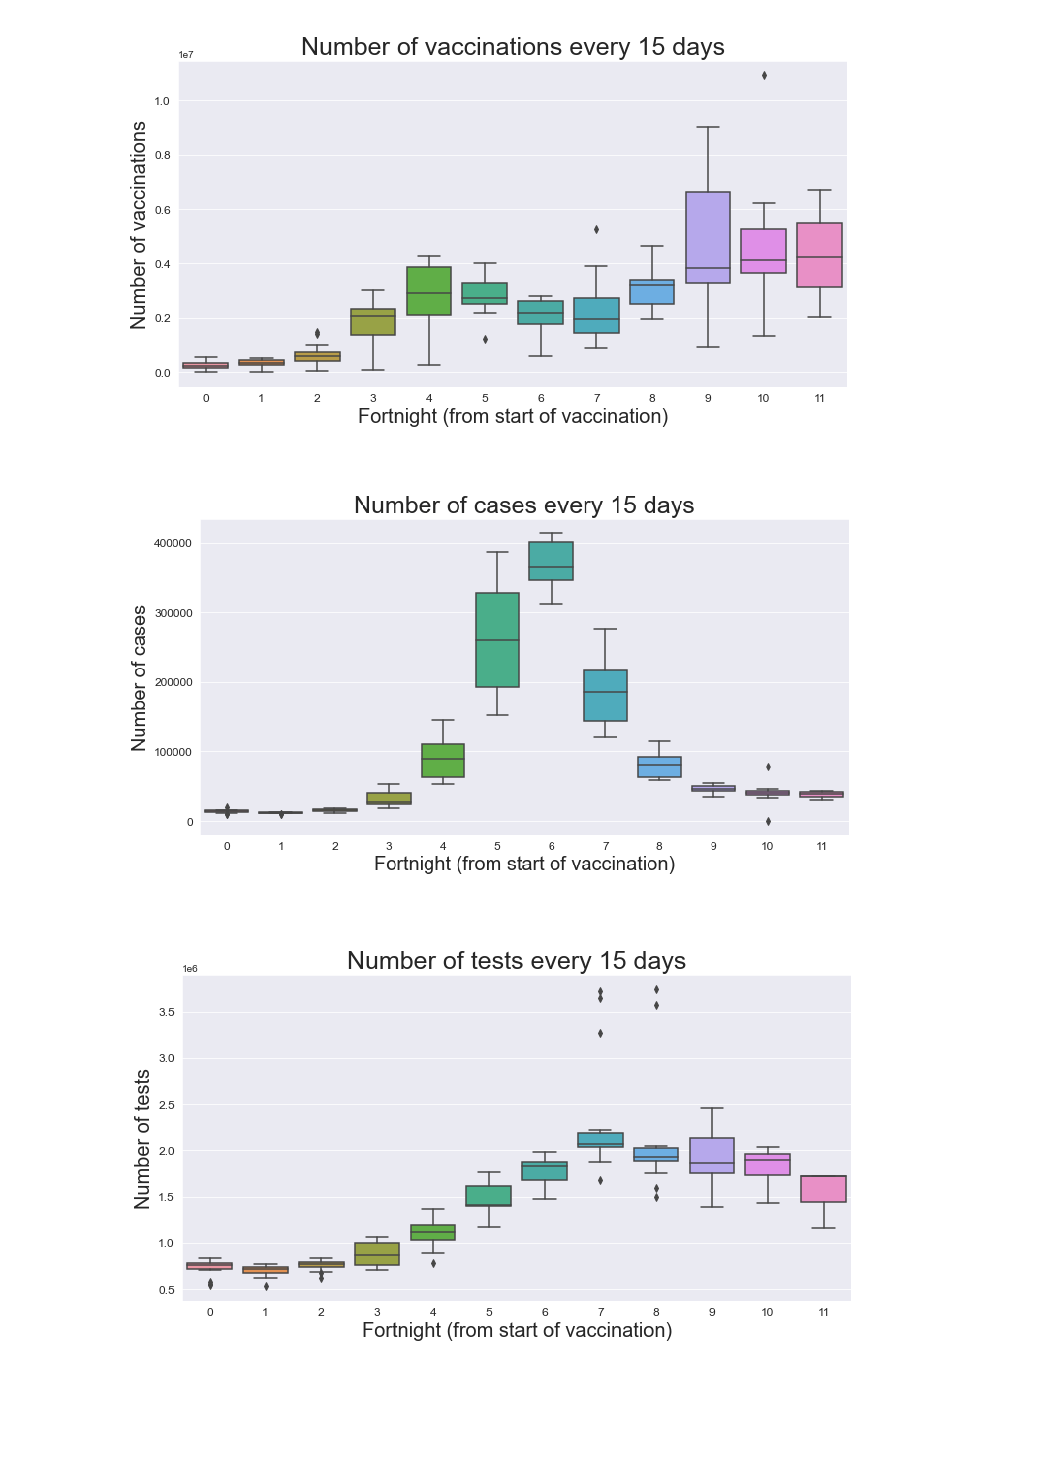
Vaccinations, tests and cases since 16 Jan, 2021
The box plot represents the inter-quartile range.
The points outside the box represent the outliers of the data.
The width denotes the scatter of the data and the height shows maximum value.
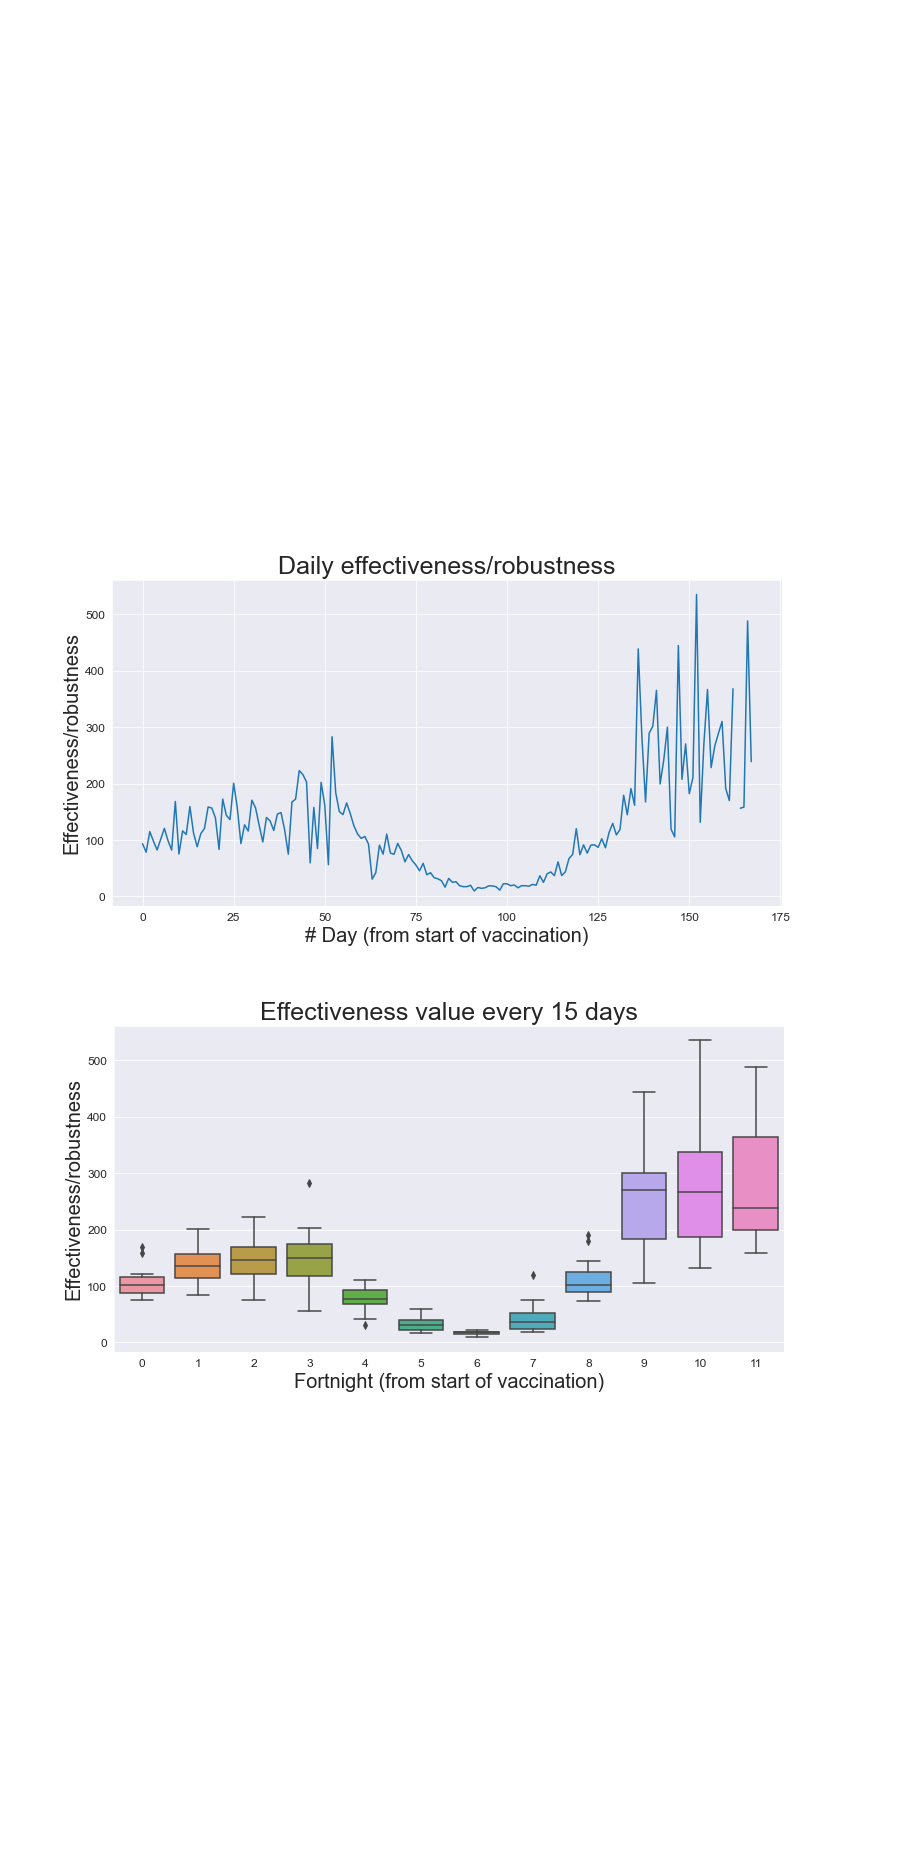
Effectiveness measure
COVID-19 effectiveness (R) for a region over a period of time is defined
which is used for the further visualizations -
R(effectiveness) = (0.4tests+0.6vax)/(0.3cases+0.7deaths)
{All parameters used are in terms of number of people}
Higher the value of the metric, the better the effectiveness of the region against COVID-19.
(I) Numerator - (maximize) COVID-19 detection / prevention:
Tests - Important, but not as much as getting vaccinated :- weight - 40%
Vaccinations - More important but testing cannot be ignored:- weight: 60%
Tests and Vaccinations form the numerator and infer how the region is fighting the virus.
(II) Denominator - (minimize) Challenges/problems faced due to COVID-19:
Cases - Considering the recovery rate of COVID-19, cases are dangerous but not as much as deaths:- weight - 30%
Deaths - Most significant impact of the virus:- weight - 70%
The parameter 'R' tells us how a region (during a certain interval) is faring in the face of the pandemic.
(whether the undesirable denominator is dominating or if the preferable numerator is more influential).
Since all the factors of this metric are positive, R is always > 0.
During the extremely severe 2nd wave that hit the country from 70 to 130 days after the commencement
of vaccination, effectiveness drastically degraded to a value close to zero.
(9.51 to be precise, whereas the maximum value was around 550)
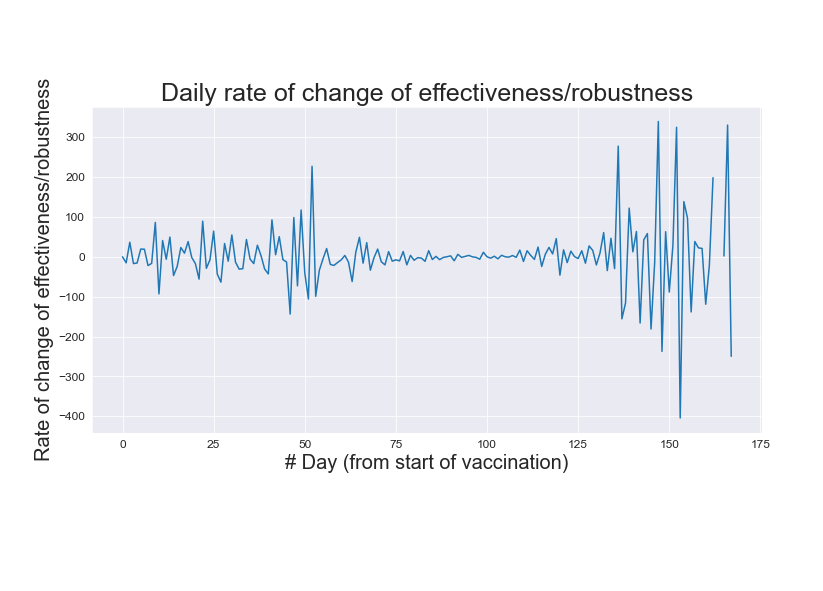
Rate of effectiveness
Signifies the change in situation from the previous day (for better or the worse). During the period of stupendous case load (May-June), the effectiveness stayed put at zero. There are normal fluctuations - in the case of any rate variable, with the degree of deviation rising with time, owing to the increased awareness about COVID-19.
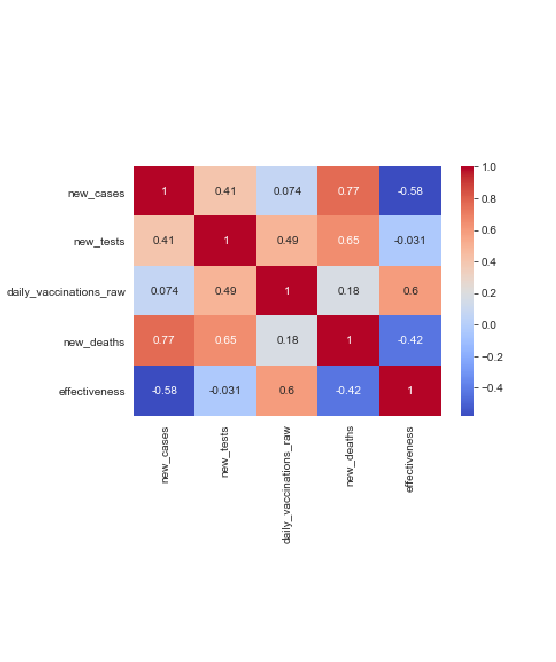
Correlation matrix
The correlation matrix shows how the different variables are related with each other.
Effectiveness relates negatively with the number of cases and the number of deaths, as expected.
Effectiveness wrt to the raw number of daily vaccinations is naturally positive, since it is directly proportional
The factor of effectiveness has a fractionally negative interdependence on the number of tests conducted,
which is counter-intuitive. This could be due to the rate of growth of cases far exceeding the rate of growth of tests.
The values and signs of these correlation factors can be considered to be a result of: -
1. the definition and the weightage given to each term in the metric
2. the factors driving the government to enhance the rate of vaccinations/tests
Thanks for visiting our page!
Om
Abishek
Sonal
Roshni
Reference Datasets:
1. Cowin_Dashboard2. Covid19_India_API
3. Kaggle-world_vaccination
4. Kaggle-New_Corona_virus_dataset
5. Kaggle-Covid19-India
Copyright © 2021 Vizathon21, Track: Public Health | Designed by Template Mo